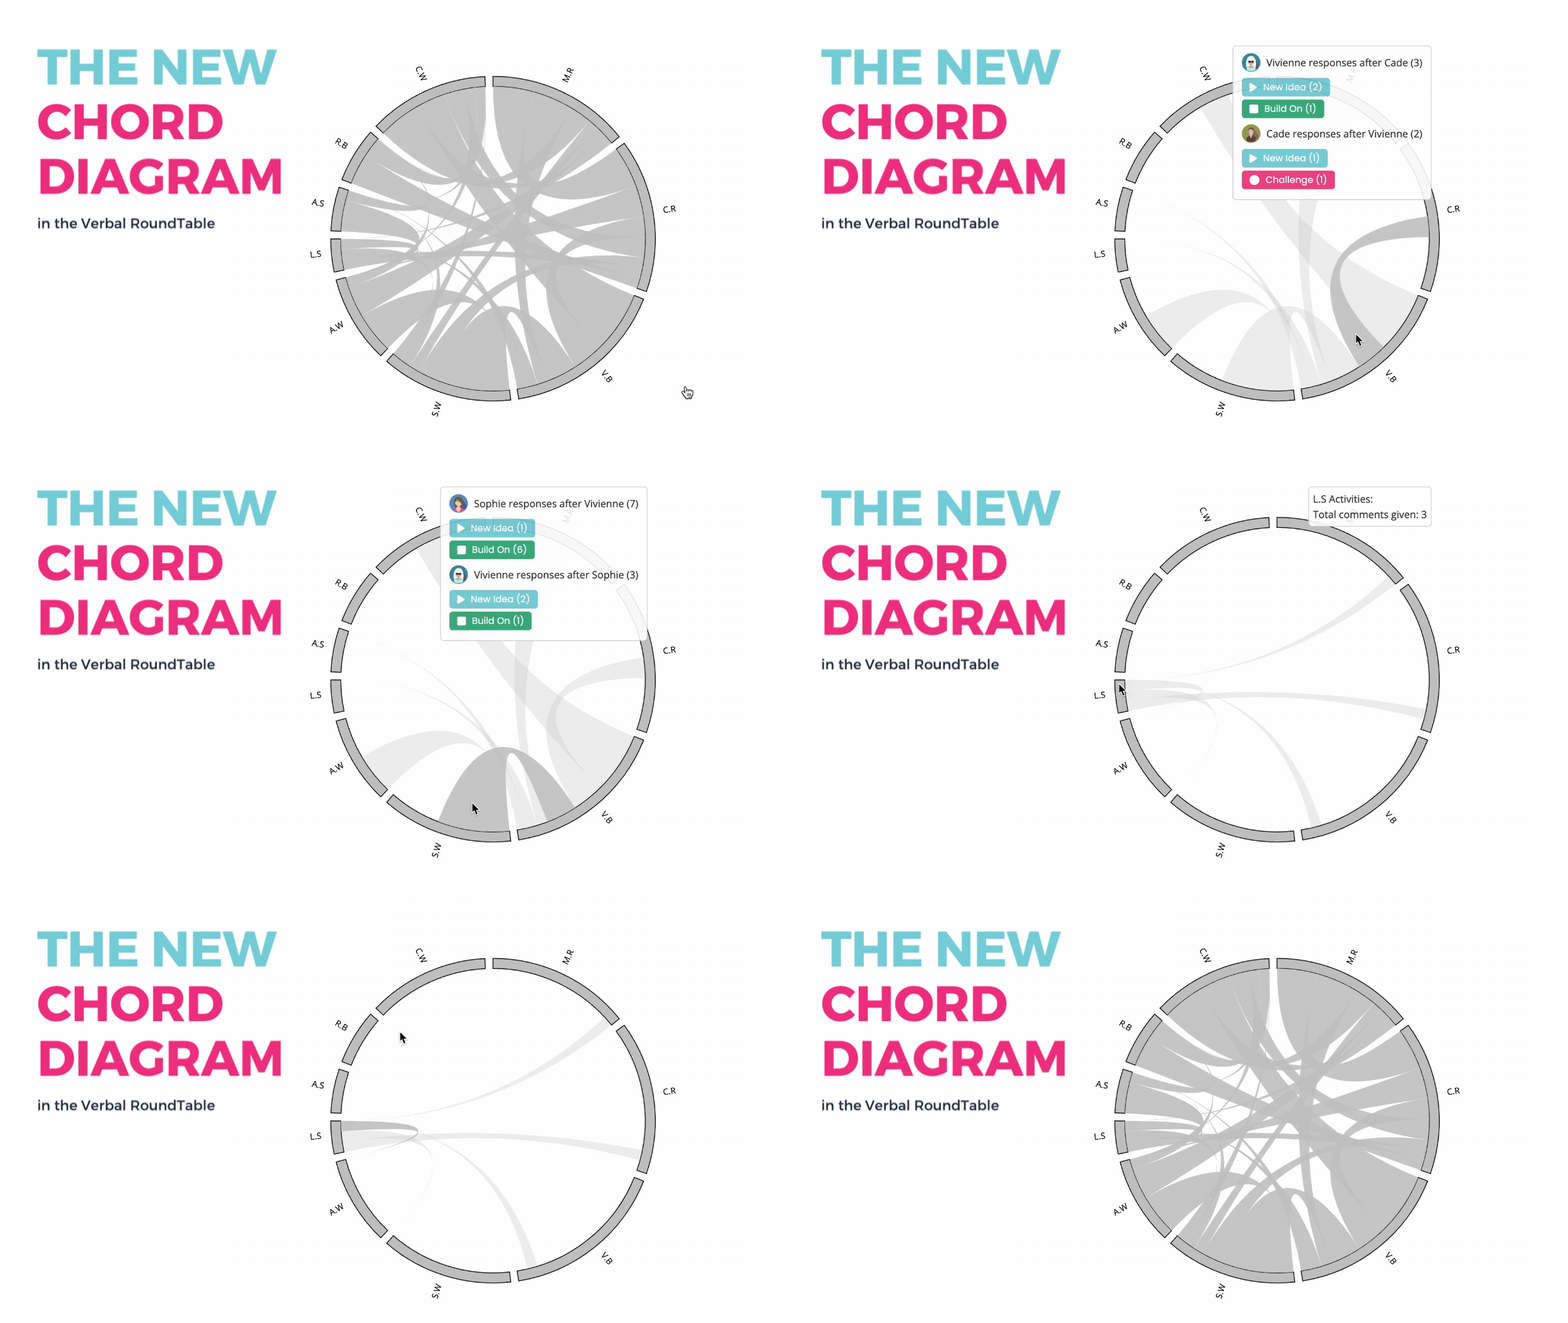
There's a feature that teachers have been requesting for quite a while, and it's finally here!
Introducing the Verbal RoundTable Chord Diagram!
This will help you and your students visualize classroom discussions and analyze student interactions:
- See the connections between student contributions and track who spoke after whom.
- Highlight this graph in your class reflection to see patterns, encourage more balanced participation and bring quieter students into the conversation.
- Use the Chord Diagram to identify opportunities for students to challenge, build on, or question each other’s ideas.
Both teachers and students can access the Chord Diagram in the summary tab of any Verbal RoundTable. This will be especially helpful if you are using the queue system to add build ons, challenges, and questions to speak after the current speaker.

This new data visualization has been inspired by the Harkness Method of tracking discussions. Check out more here.